"THINK SMARTLY, THINK AHEAD"
::: SWING VOLUME PATTERN CHART ::: ::: THE FORMULA TO BEAT, SMART MONEY :::
::: ITS ALL ABOUT VOLUME & LEVEL BASE GAME :::
We are Offering Two Types of Trading Platform ABN Hybrid & Hybrid-Lite :: Just Click To Know More
JOIN OUR NEW SMS SERVER - EXCLUSIVE & INSTANT DELV - SEND SMS JOIN ABNSTKS TO 58247
Just Click To Submit Your Detail's - Info's For Our Future Reference & Exclusive Offers
"Click Here For ABN Paid Advisory Services" - "Intraday Nifty Future & Positional Stock Pick"

Friday, December 31, 2010

AVOID SHORT IN MARKET ..... CAN CARRY LAKSHMIEFL AS BTST


AVOID SHORT IN MARKET .....
WAIT FOR AN UPDATE BEFORE TAKING SHORT ....
STILL SOME JUICE LEFT IN MARKET (6210) .....

CAN CARRY LAKSHMIEFL AS BTST TARGET AND STOPLOSS REMAIN THE SAME

IBREALEST 139 ..... DLF 295 ...


INTRADAY BUY LAKSHMI ENERGY AND FOODS (LAKSHMIEFL) CMP 73.50 SL 71.50 TGT 82 / 85


WISHING YOU A VERY HAPPY & PROSPEROUS NEW YEAR 2011


WISHING YOU A VERY HAPPY & PROSPEROUS NEW YEAR 2011

HOPE NO ONE IS LEFT OUT OR MISSED THE RALLY HOPE ALL ENJOYING THE RALLY WITH TIMELY UPDATE


ONE CAN START BOOKING PROFIT IN 3-4 PARTS ON RISE ... WILL UPDATE SOON ON WHEN TO TAKE SHORTS @ ?? SL ?? TARGETS


ALL STOCKS AND NIFTY ROCKING .... ENJOY .....


NIFTY / DLF / IBREALEST / HCC / EDUCOMP / SESAGOA / BALRAMPUR CHINI / DELTACOP ...
EXCEPT LITL ALL STOCKS AND NIFTY ROCKING
ENJOY....

OM SHRI GANESHAYA NAMAH

Thursday, December 30, 2010

INTRADAY BUY DLF ONLY ABOVE 288.50 STOPLOSS 284 TARGET 293 / 295 / 298 "CASH LEVELS"


NIFTY DAILY OUTLOOK DEC 30, 2010


On Wednesday, market opened on positive node and traded higher in the range thru out the day with buying across all the indices and closed up in green. Major buying interest was seen in FMGC, Metals and Banks. Volume for the day was higher then previous trading session. Market breadth was positive. Midcap index and Small caps index closed up in green.

For the day, the level of 6045 and 6015 may act as a major support for the market and the level of 6085 and 6115 may act as a major hurdle. Market may attract buying and be cautious at higher levels.

Medium term trend will turn positive above the level of 6065.

"Spot Levels" Day trader can go long on nifty above 6085 with stop loss 6060 for target 6115 / 6145 and can go short below 6045 with stop loss 6070 for target 6015 / 5985.

Index Range

Nifty: 6060.35
Range: 6015-6115
Resistance: 6085-6115-6145
Support: 6045-6015-5990

Bank Nifty: 11612.90
Range: 11450-11790
Resistance: 11680-11740-11790
Support: 11570-11510-11450

Short term: Up (5970)
Medium term: Down (6065)
Long term: Up (5350)

Cash Market Trading Activity (Prov. Figure in Rs. Crores)

Cat: Buy Val - Sell Val=   Net Val
FII:  1768.80-1221.22= +547.58
DII:  803.82 - 974.16=   -170.34

All Above Spot Levels

OM SHRI GANESHAYA NAMAH

Wednesday, December 29, 2010

NIFTY SPOT SUSTAIN ABOVE 6045 WILL TRY FOR 6060 / 6073 / 6090


INTRADAY BUY DLF ABOVE 288.50 STOPLOSS 284 TARGET 293 / 295 / 298 "CASH LEVELS"


INTRADAY BUY DLF ABOVE 288.50
STOPLOSS 284
TARGET 293 / 295 / 298
"CASH LEVELS"

OM SHRI GANESHAYA NAMAH

NIFTY DAILY OUTLOOK DEC 29, 2010


On Tuesday, market opened on positive node and traded in the narrow range thru out the day and closed down flat in red. FMGC, IT and Pharma attract buying whereas Oil & Gas, Auto, Capital Goods and Banks traded week. Overall it was slightly volatile trading session. Volume for the day was lower then previous trading session. Market breadth was negative. Midcap index and Small caps index closed up in green.

For the day, the level of 5965 and 5940 may act as a major support for the market and the level of 6025 and 6050 may act as a major hurdle. Market may attract buying.

Medium term trend will turn positive above the level of 6065.

"Spot Levels" Day trader can go long on nifty above 6025 with stop loss 5995 for target 6050 / 6080 and can go short below 5965 with stop loss 5995 for target 5940 / 5910.

Index Range

Nifty: 5996
Range: 5940-6050
Resistance: 6025-6050-6080
Support: 5965-5940-5910

Bank Nifty: 11427.30
Range: 11230-11630
Resistance: 11515-11570-11630
Support: 11350-11290-11230

Short term: Up (5970)
Medium term: Down (6065)
Long term: Up (5350)

Cash Market Trading Activity (Prov. Figure in Rs. Crores)

Cat: Buy Val - Sell Val=   Net Val
FII:  1328.12-1219.09= +109.03
DII:  716.35 - 981.71=   -265.36

All Above Spot Levels

OM SHRI GANESHAYA NAMAH

Monday, December 27, 2010

MARKET VERY BULLISH AVOID SHORT IN MARKET


BUY IBREALEST ABOVE 132.50 :: TARGET 155-160-165 :: TIME FRAME 3-4 DAYS


BUY IBREALEST ABOVE 132.50
CONDITION CLOSING REQUIRED ABOVE 132.50
STOPLOSS 125 CLOSING BASIS
TARGET 155-160-165
TIME FRAME 3-4 DAYS

OM SHRI GANESHAYA NAMAH

NIFTY WEEKLY & DAILY OUTLOOK DEC 27, 2010


Last week the range for market was given between 5835-5970, however market traded near the higher end of the range thru out the week and close at 6011.60. For this week keep on holding the long position as advice last week above the level of 5970, further long position can be added above the level of 6065 with stop loss  of 5930 on closing basis on nifty spot for target 6170 / 6280 / 6390. Our view remain positive on market, we recommend buy on dips. Further update would be given during the week.

For the day, the level of 5990 and 5960 may act as a major support for the market and the level of 6030 and 6060 may act as a major hurdle. Market may attract buying and buy sugar and banking stocks.

Medium term trend will turn positive above the level of 6065.

"Spot Levels" Day trader can go long on nifty above 6030 with stop loss 6000 for
target 6060 / 6085 and can go short below 5990 with stop loss 6020 for target 5960 / 5935.

Index Range

Nifty: 6011.60
Range: 5960-6060
Resistance: 6030-6060-6085
Support: 5990-5960-5935

Bank Nifty: 11477
Range: 11290-11625
Resistance: 11515-11570-11625
Support: 11405-11350-11290

Short term: Up (5970)
Medium term: Down (6065)
Long term: Up (5350)

Cash Market Trading Activity (Prov. Figure in Rs. Crores)

Cat: Buy Val - Sell Val=   Net Val
FII:  1221.23-1206.41= +14.82
DII:  651.84 - 948.40=   -296.56

All Above Spot Levels

OM SHRI GANESHAYA NAMAH

Saturday, December 25, 2010

Jingle bells Jingle bells Jingle all the way...wishing u all a Merry Christmas :) God Bless!!!


May Peace be your gift at Christmas and your blessing all year through !
1 X'mas Tree!,1 Lakh Candles!,1 Crore Baloons!,1 Million Stars!,1 Billion Wishes,&.. 1 Hearty wish to u ... MERRY CHRISTMAS!!!..

Friday, December 24, 2010

AGAIN REPEATING AVOID SHORT IN MARKET.... EOD NIFTY SPOT CHART - LONG - SHORT - VIEW


AGAIN REPEATING AVOID SHORT IN MARKET....
MARKET SOON HEADING FOR 6180-6210 LEVELS WITH MINOR HURDLE AT 6065 ALL SPOT LEVELS

IT'S SHORT ACCUMULATE ABOVE 6150 WITH SL 6280 WEEKLY CLOSING ALL SPOT LEVELS

6180-6210>>>>5400-5600

OM SHRI GANESHAYA NAMAH

NIFTY DAILY OUTLOOK DEC 24, 2010


On Thursday, market opened on positive node and traded in the narrow range thru out the day and closed down flat in red. Pharma and IT attract buying whereas Metals, Auto and Capital Goods traded week. Overall it was the volatile trading session. Volume for the day was much lower then previous trading session. Market breadth was negative. Midcap index and Small caps index closed down in red.

For the day, the level of 5965 and 5940 may act as a major support for the market and the level of 5995 and 6025 may act as a major hurdle. Market may attract buying.

Medium term trend will turn positive above the level of 6065.

"Spot Levels" Day trader can go long on nifty above 5995 with stop loss 5965 for target 6025 / 6055 and can go short below 5965 with stop loss 5995 for target 5940 / 5910.

Index Range

Nifty: 5980
Range: 5940-6025
Resistance: 5995-6025-6055
Support: 5965-5940-5910

Bank Nifty: 11469
Range: 11290-11625
Resistance: 11515-11570-11625
Support: 11405-11350-11290

Short term: Up (5970)
Medium term: Down (6065)
Long term: Up (5350)

Cash Market Trading Activity (Prov. Figure in Rs. Crores)

Cat: Buy Val - Sell Val=   Net Val
FII:  1490.30-1633.40= -143.10
DII:  893.35 - 981.98=  -88.63

All Above Spot Levels

OM SHRI GANESHAYA NAMAH

EOD NIFTY SPOT CHART - LONG - SHORT - VIEW


BOOK LONG NEAR / ON CROSSOVER OF BLUE LINE (BLUE POINT 6)

GO SHORT ON CROSS BELOW RED LINE (RED POINT 5) FOR (RED POINT 6)
OM SHRI GANESHAYA NAMAH

Astro View on Nifty 24th December 2010


•Today, the moon is in the Pushya Nakshatra.

•From 9:15 to 12:05, there is a very strange pattern in the market, as initial first half will have up jobbing and suddenly it will have down jobbing. Be careful. Focus on a particular scrip, and ideally, avoid trading during this period.

•From 13:13 to 13:45, NIFTY may be down.

•From 13:46 to 14:19, NIFTY may be up.

Source: GaneshaSpeaks

OM SHRI GANESHAYA NAMAH

Thursday, December 23, 2010

NIFTY UPDATE AND VIEWS :: SESAGOA AND EDUCOMP


AVOID SHORT IN MARKET ...
NIFTY LOOKING STRONG ...
MARKET MAY START RALLY FROM TODAY OR TOMMORROW ...
AGAIN WE REPEAT AVOID SHORT IN MARKET ..
MARKET BOTTOMING OUT..
NIFTY SPOT ALREADY GIVEN 2 DAYS CLOSE ABOVE 5970 ...
MINOR HURDLE AT 6065 OUR TARGET ON NIFTY 6180-6210 SL 5890 CLOSING

FOR SHORT TERM SESAGOA AND EDUCOMP LOOKS GOOD

OM SHRI GANESHAYA NAMAH

NIFTY DAILY OUTLOOK DEC 23, 2010


On Wednesday, market opened up with a small gap and traded higher in the narrow range however during second half market attract huge selling from the higher levels but manage to recover the most of the day loss near the closing session and close down in red. Metals and FMGC outperformed whereas Oil & Gas and Capital Goods under performed. Overall it was the highly volatile trading session. Volume for the day was lower then previous trading session. Market breadth was positive Midcap index and Small caps index closed up in green.

For the day, the level of 5965 and 5940 may act as a major support for the market and the level of 5995 and 6025 may act as a major hurdle.

Medium term trend will turn positive above the level of 6065.

"Spot Levels" Day trader can go long on nifty above 5995 with stop loss 5965 for target 6025 / 6055 and can go short below 5965 with stop loss 5995 for target 5940 / 5910.

Index Range

Nifty: 5984.40
Range: 5940-6025
Resistance: 5995-6025-6055
Support: 5965-5940-5910

Bank Nifty: 11467.70
Range: 11300-11635
Resistance: 11525-11580-11635
Support: 11415-11360-11300

Short term: Up (5970)
Medium term: Down (6065)
Long term: Up (5350)

Cash Market Trading Activity (Prov. Figure in Rs. Crores)

Cat: Buy Val - Sell Val=   Net Val
FII:  2375.65-2443.22= -67.57
DII:  1252.32-1153.39= +98.93

All Above Spot Levels

OM SHRI GANESHAYA NAMAH

Astro View on Nifty 23rd December 2010


•From today, Sun and Rahu have come into the same degree and same navmansh, which doesn't seem pleasing to Ganesha.

•Moon is in the Punarvasu Nakshatra of the sign Cancer, today.

•NIFTY may remain up for the period between 9:15 to 11:30 

•12:10 to 13:50, initially buying will be in up. During the last thirty minutes, you may observe some selling pressure. 

Source: GaneshaSpeaks

OM SHRI GANESHAYA NAMAH

Wednesday, December 22, 2010

INTRADAY CASH BUY TATASTEEL CMP 675 - 675.50 STOPLOSS 670 TARGET 683 / 686 / 690


NIFTY DAILY OUTLOOK DEC 22, 2010


On Tuesday, market opened positive and moved higher thru out the day with good buying in almost all the indices however during final hour of session market became slightly volatile and closed up in green. Metals and bank outperformed whereas IT under performed. Volume for the day was higher then previous trading session. Market breadth was positive. Midcap index and Small caps index closed up in green.

For the day, the level of 5965 and 5940 may act as a major support for the market and the level of 6025 and 6055 may act as a major hurdle.

Medium term trend will turn positive above the level of 6065.

"Spot Levels" Day trader can go long on nifty above 6025 with stop loss 5995 for target 6055 / 6080 and can go short below 5965 with stop loss 5995 for target 5940 / 5910.

Index Range

Nifty: 6000.65
Range: 5940-6055
Resistance: 6025-6055-6080
Support: 5965-5940-5910

Bank Nifty: 11537.30
Range: 11360-11745
Resistance: 11630-11690-11745
Support: 11465-11410-11360

Short term: Up (5970)
Medium term: Down (6065)
Long term: Up (5350)

Cash Market Trading Activity (Prov. Figure in Rs. Crores)

Cat: Buy Val - Sell Val=   Net Val
FII:  2850.75-2885.54= -34.79
DII:  1631.12-1257.45= +373.67

All Above Spot Levels

OM SHRI GANESHAYA NAMAH

Astro View on Nifty 22nd December 2010


•Moon is in the Aardra Nakshatra of the sign Gemini, today.

•Market will be up from the period between 9:15 to 10:20

•From 13:25 till the end of the trading day, like an earthquake, there will be some after shocks in the market, confusing you about the direction in which to go to. Do not trade, unless you have the skill to sail through.

Source: GaneshaSpeaks

OM SHRI GANESHAYA NAMAH

Tuesday, December 21, 2010

NIFTY DAILY OUTLOOK DEC 21, 2010


On Monday, market opened negative but latter attracted good buying in mostly all the indices and traded higher however during final hour of trading session market lost most of the gain and closed down flat. Auto and IT outperformed whereas Banks and Realty under performed. Overall it was a highly volatile trading session. Volume for the day was slightly lower then previous trading session. Market breadth was positive. Midcap index closed down in red whereas Small caps index closed up in green.

For the day, the level of 5915 and 5890 may act as a major support for the market and the level of 5970 and 6000 may act as a major hurdle. Market may attract good buying.

Short term trend will turn positive above the level of 5970.

"Spot Levels" Day trader can go long on nifty above 5970 with stop loss 5940 for target 6000 / 6030 and can go short below 5915 with stop loss 5945 for target 5890 / 5860.

Index Range

Nifty: 5947.05
Range: 5890-6000
Resistance: 5970-6000-6030
Support: 5915-5890-5860

Bank Nifty: 11267.10
Range: 11085-11415
Resistance: 11305-11385-11415
Support: 11195-11140-11085

Short term: Down (5970)
Medium term: Down (6065)
Long term: Up (5350)

Cash Market Trading Activity (Prov. Figure in Rs. Crores)

Cat: Buy Val - Sell Val=   Net Val
FII:  2973.75-3083.28= -109.53
DII:  1161.90-1022.45= +139.45

All Above Spot Levels

OM SHRI GANESHAYA NAMAH

Sunday, December 19, 2010

NIFTY WEEKLY & DAILY OUTLOOK DEC 20, 2010


Last week we had given range for the market of 5845-5970, market traded within the range and close near the higher end of the range. For this week also range is likely to be between 5845-5970. Look for buying only if market remains above the level of 5970 with stop loss of 5890 on closing basis on nifty spot, further buying can be done in market above the level of 6065 for target 6170 / 6280 / 6390 and look for selling only if market remains below the level of 5845 with stop loss of 5930 on closing basis on nifty spot, further selling can be done in market below the level of 5735 for target 5625 / 5515 / 5410

For the day, the level of 5915 and 5890 may act as a major support for the market and the level of 5970 and 6000 may act as a major hurdle. Market may attract good buying.

Short term trend will turn positive above the level of 5970.

"Spot Levels" Day trader can go long on nifty above 5970 with stop loss 5940 for target 6000 / 6030 and can go short below 5915 with stop loss 5945 for target 5890 / 5860.

Index Range

Nifty: 5948.75
Range: 5890-6000
Resistance: 5970-6000-6030
Support: 5915-5890-5860

Bank Nifty: 11424.20
Range: 11155-11705
Resistance: 11485-11595-11705
Support: 11370-11265-11155

Short term: Down (5970)
Medium term: Down (6065)
Long term: Up (5350)

Cash Market Trading Activity (Prov. Figure in Rs. Crores)
Cat: Buy Val - Sell Val=   Net Val
FII:  3083.85-3400.64= -316.79
DII:  1518.41-1422.38= +96.03

All Above Spot Levels

OM SHRI GANESHAYA NAMAH

Thursday, December 16, 2010

Astro View on Nifty 16th December 2010


•December's highly volatile, widely fluctuating dates are: 7 (-19), 8 (-72), 16, 17, 21, 22, 23, 24
•During this week, the trading is likely to be only for four days, so make a note of it.
•As per last Thursday's prediction, you must have noted that because of Mars-Rahu, Nifty was highly volatile and unpredictable.
•Today, Moon is in the Revati Nakshatra
•Coming week is not good for personal horoscope. Those with the sign Sagittarius, may see a gathering of all the fire elements viz. Sun, Rahu, Mars and Mercury in their zodiac sign. And this combination is not at all favourable for the nation's kundali. Ganesha warns you of mishaps.•It's the best day for jobbers, arbitragers, speculation and playing a blind game.

Source: GaneshaSpeaks

OM SHRI GANESHAYA NAMAH

Wednesday, December 15, 2010

NIFTY DAILY OUTLOOK DEC 15, 2010


On Tuesday, market opened higher and traded in the narrow range during first hour of the trading session however latter market attract good buying in almost all the indices and closed up in green with good gains. Metals and Consumer Durable outperformed whereas Auto and FMCG under performed. Overall it was the volatile trading session. Volume for the day was slightly lower then previous trading session. Market breadth was positive. Midcap index closed up 1.5% and Small caps index closed up 1.6%.

For the day, the level of 5915 and 5890 may act as a major support for the market and the level of 5970 and 6000 may act as a major hurdle. Market may remain highly volatile.

Short term trend will turn positive above the level of 5970.

"Spot Levels" Day trader can go long on nifty above 5970 with stop loss 5940 for target 6000 / 6030 and can go short below 5915 with stop loss 5945 for target 5890 / 5860.

Index Range

Nifty: 5944.10
Range: 5890-6000
Resistance: 5970-6000-6030
Support: 5915-5890-5860

Bank Nifty: 11560.50
Range: 11400-11735
Resistance: 11625-11680-11735
Support: 114515-11460-111400

Short term: Down (5970)
Medium term: Down (6070)
Long term: Up (5350)

Cash Market Trading Activity (Prov. Figure in Rs. Crores)

Cat: Buy Val - Sell Val=   Net Val
FII:  2512.96-2479.43= +33.53
DII:  1072.90-723.73=  +349.17

All Above Spot Levels

OM SHRI GANESHAYA NAMAH

Astro View on Nifty 15th December 2010


•December's highly volatile, widely fluctuating dates are: 7 (-19), 8 (-72), 16, 17, 21, 22, 23, 24
•During this week, the trading is likely to be only for four days, so make a note of it.
•Last Wednesday Ganesha had predicted that you may earn a small amount after a lot of intraday. You must have practically experienced this.
•Today, the Moon is in the same Nakshatra and zodiac sign, but debilitated in the Navmansh Kundali. This may result in the loss of power.
•Today's and tomorrow's closing time is not at all reliable, warns Ganesha. Follow His advise or you may have to regret your decision.
•From 11:05 to 11:40, and from 15:10 to 15:30, there are chances that the market makes a similar pattern.

Source: GaneshaSpeaks

OM SHRI GANESHAYA NAMAH

Tuesday, December 14, 2010

NIFTY DAILY OUTLOOK DEC 14, 2010


On Monday, market opened flat with some selling pressure, but latter attracted good buying in mostly all the indices and traded higher thru out the day. Market closed up in green with good gains. Metals, Realty, Capital Goods and Power outperformed whereas FMCG under performed. Overall it was a highly volatile trading session. Volume for the day was slightly lower then previous trading session. Market breadth was positive. Midcap and Small caps index closed up in green.

For the day, the level of 5890 and 5865 may act as a major support for the market and the level of 5920 and 5945 may act as a major hurdle. Market may remain highly volatile, be cautious at higher levels. Banks and Realty may attract selling.

Short term trend will turn positive above the level of 5970

"Spot Levels" Day trader can go long on nifty above 5920 with stop loss 5890 for target 5945 / 5975 and can go short below 5890 with stop loss 5920 for target 5865 / 5835.

Index Range

Nifty: 5907.65
Range: 5835-5975
Resistance: 5920-5945-5975
Support: 5890-5865-5835

Bank Nifty: 11518.10
Range: 11360-11690
Resistance: 11580-11635-11690
Support: 11460-11410-111360

Short term: Down (5970)
Medium term: Down (6070)
Long term: Up (5350)

Cash Market Trading Activity (Prov. Figure in Rs. Crores)

Cat: Buy Val - Sell Val=   Net Val
FII: Data N/A
DII: Data N/A

All Above Spot Levels

OM SHRI GANESHAYA NAMAH

Astro View on Nifty 14th December 2010


•December's highly volatile, widely fluctuating dates are: 7 (-19), 8 (-72), 16, 17, 21, 22, 23, 24
•During this week, the trading is likely to be only for four days, so make a note of it.
•According to Ganesha's last Tuesday's prediction in the same column, you must have observed that the market went hay-wire as Moon & Rahu were in conjunction.
•Today, Moon is in the Uttarbhadrapada constellation of the zodiac sign ? Pisces.
•Today, Moon-Jupiter enjoys Gajkesari Yog.

Source: GaneshaSpeaks

OM SHRI GANESHAYA NAMAH

Global Market Update : Cautious recovery : By Colin Twiggs


By Colin Twiggs
December 13, 2010 3:00 a.m. ET (7:00 p.m. AEDT)

These extracts from my trading diary are for educational purposes and should not be interpreted as investment or trading advice.

USA

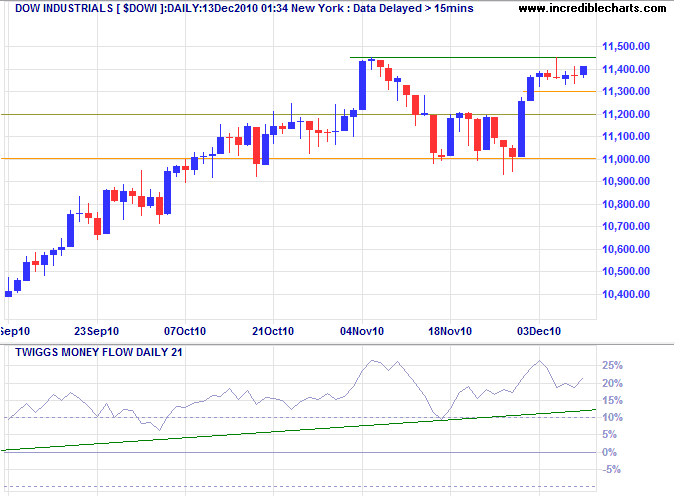
Dow Jones Industrial Average

The Dow is consolidating in a narrow rectangle below resistance at 11450, a bullish sign. Breakout would confirm the S&P 500 and signal an advance to 12000*. Rising Twiggs Money Flow (21-day) reflects strong buying pressure. Reversal below 11000 is now unlikely, but would also warn of a primary trend reversal.
Dow Jones Industrial Average
* Target calculation: 11000 + ( 11000 - 10000 ) = 12000


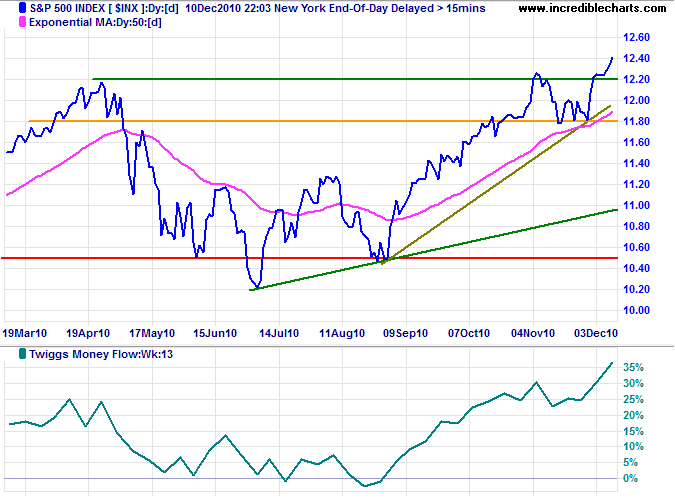
S&P 500

The S&P 500 followed through above 1220 to signal a primary advance. Rising Twiggs Money Flow (13-week) indicates strong buying pressure. The target for a primary advance is 1420*. Reversal below 1180 is most unlikely, but would warn of a bull trap.
Standard & Poors 500 chart
* Target calculation: 1220 + ( 1220 - 1020 ) = 1420

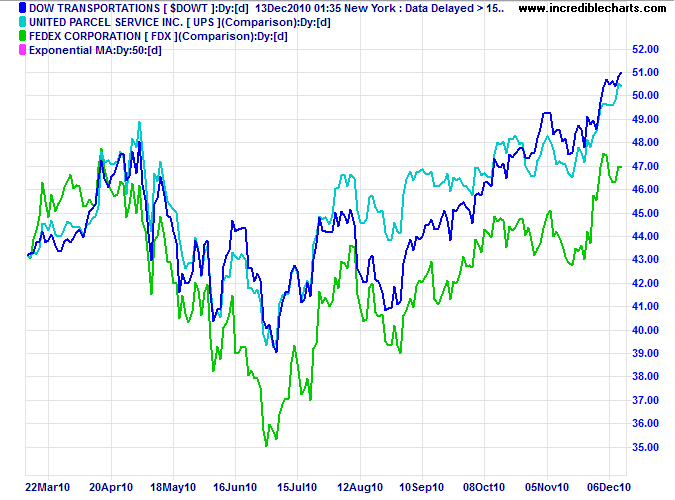
Transport

Dow Jones Transport Index and major components, Fedex and UPS, are all advancing strongly. A bullish sign for the economy.
Fedex, Dow Transport Index


Technology

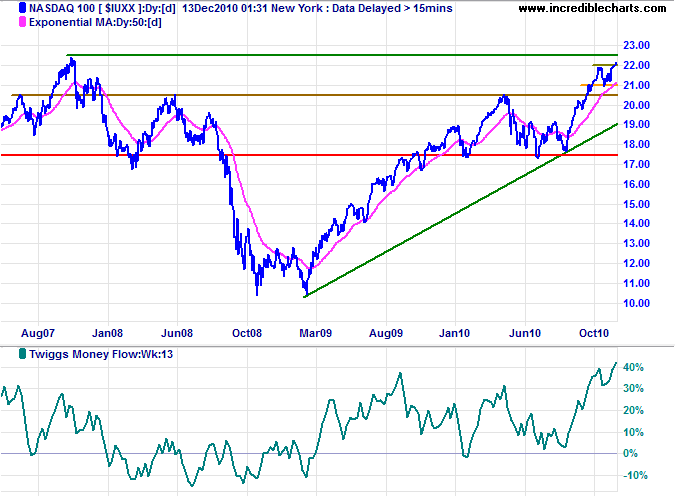
The Nasdaq 100 is headed for a test of its 2007 high at 2250. Breakout would signal a fresh primary advance. A Twiggs Money Flow (13-week) trough high above zero again indicates strong buying pressure.
Nasdaq 100
* Target calculation: 2050 + ( 2050 - 1750 ) = 2350


Canada: TSX

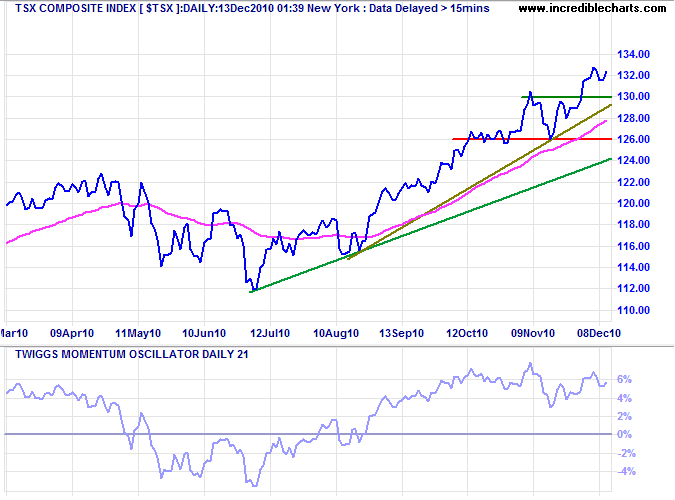
The TSX Composite advance has a target of 13400*. Twiggs Momentum holding high above zero signals a strong up-trend. Reversal below 12600 is most unlikely, but would warn of a primary trend reversal.
TSX Daily
* Target calculation: 13000 + ( 13000 - 12600 ) = 13400

United Kingdom

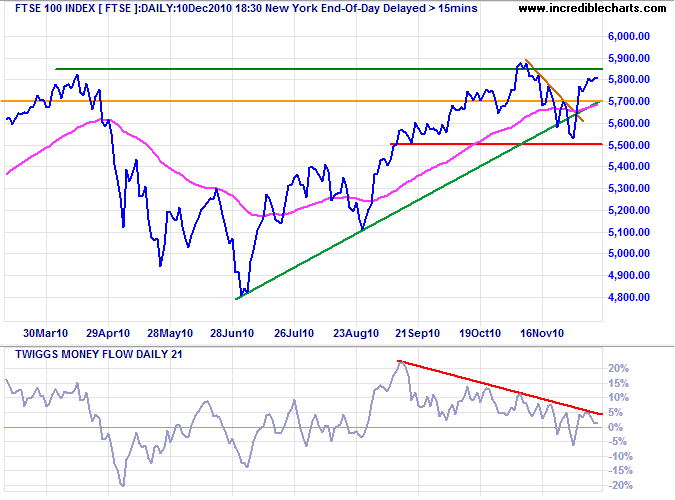
The FTSE 100 is testing resistance at 5900. Rising Twiggs Money Flow (13-week) indicates buying pressure, but this conflicts with a bearish divergence on the shorter 21-day indicator. Breakout above 5900 would signal an advance to the 2007 high at 6750*, while reversal below 5500 would warn of a primary trend reversal.
FTSE 100 Daily
* Target calculation: 5800 + ( 5800 - 4800 ) = 6800

Germany

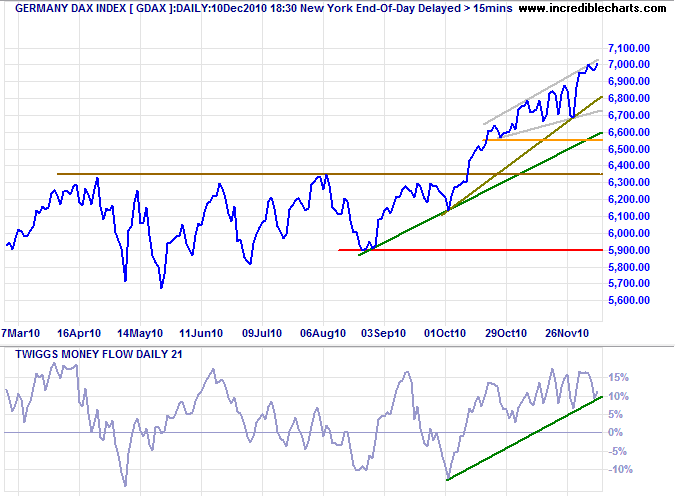
The DAX is testing resistance at 7000. Upward breakout would offer a new target of 7450*. Rising 21-day Twiggs Money Flow indicates buying pressure. The ascending broadening wedge pattern, however, is bearish, and downward breakout would signal retracement to 6550.
German DAX
* Target calculation: 7000 + ( 7000 - 6550 ) = 7450

France

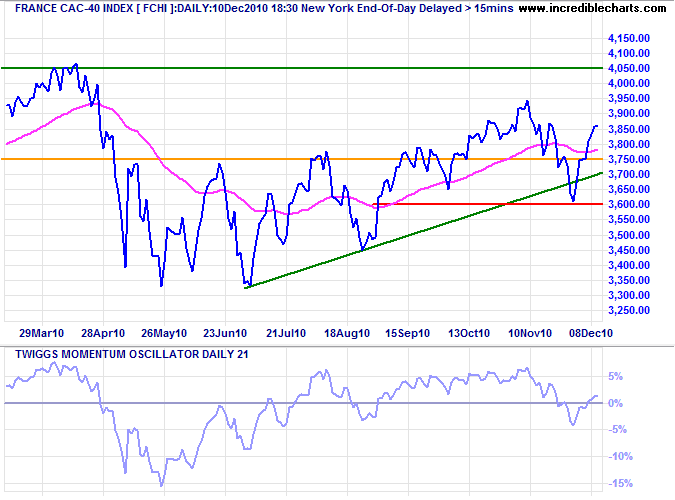
The CAC-40 is edging upwards, with rising 13-week Twiggs Money Flow indicating buying pressure. Momentum remains weak, however, and reversal below zero would warn of a trend reversal. Failure of support at 3600 would confirm.
France CAC-40
* Target calculation: 3750 + ( 3750 - 3450 ) = 4050


India

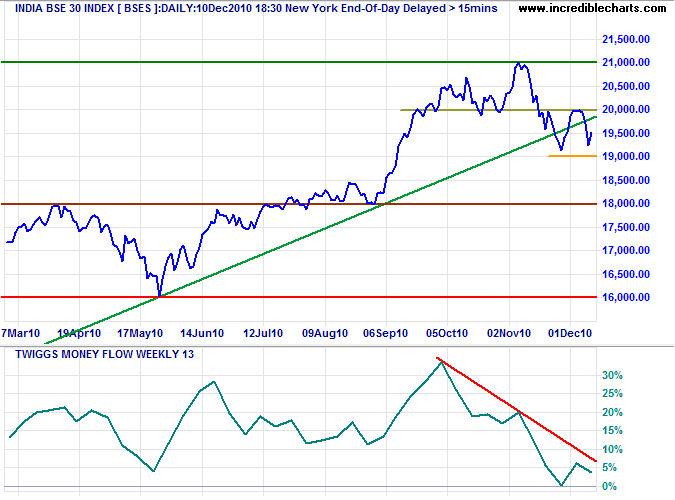
The Sensex is testing support at 19000. Declining Twiggs Money Flow (13-week) continues to indicate selling pressure. Failure of support would test 18000*.
Sensex India
* Target calculation: 19000 - ( 20000 - 19000 ) = 18000

Singapore

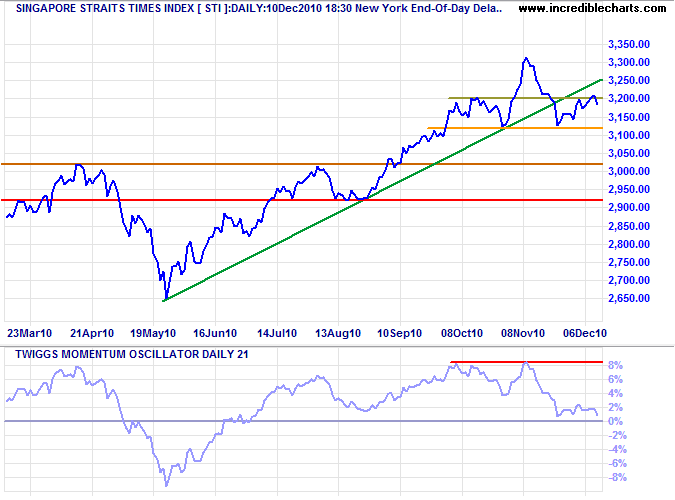
The Straits Times Index retreated below 3200. Twiggs Money Flow indicates strong selling pressure on the DJ Singapore Index. Failure of support at 3120 would complete a small head and shoulders formation, indicating a correction to primary support at 2900*. Twiggs Momentum (21-day) reversal below zero would strengthen the bear signal.
Singapore
* Target calculation: 3100 - ( 3300 - 3100 ) = 2900


Japan

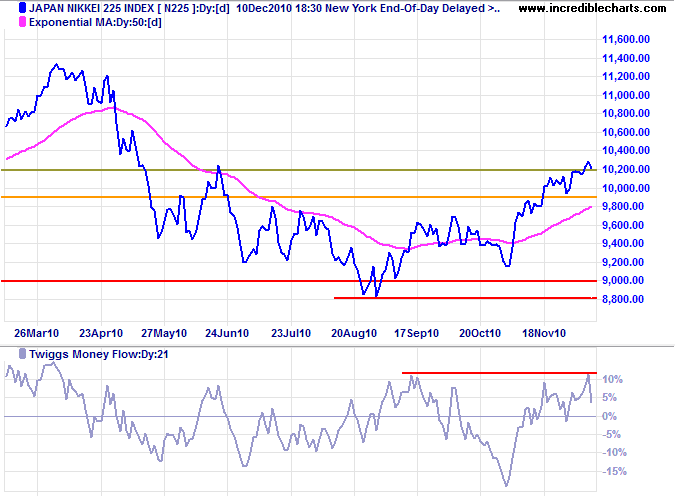
The Nikkei 225 rallied Monday, confirming the breakout above 10200. Bearish divergence on Twiggs Money Flow (21-day), however, warns of selling pressure. Expect further consolidation above the new support level. Reversal below 9900 would warn of another correction.
Japan

South Korea

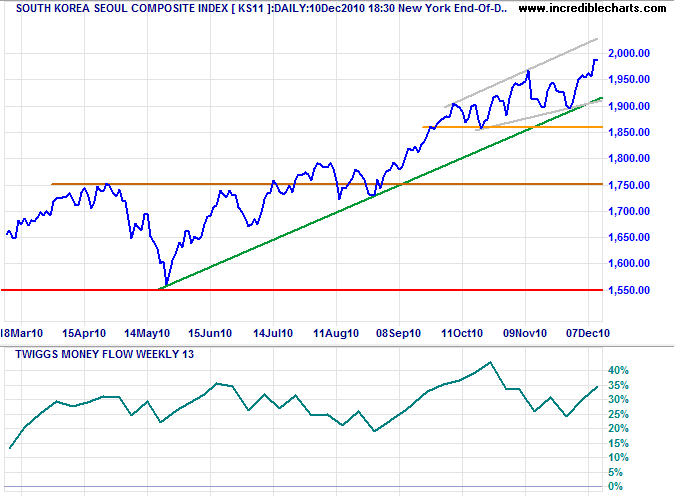
The Seoul Composite Index is headed for a test of its 2007 high at 2050. The ascending broadening wedge, similar to the DAX, however, warns of retracement to 1850. The primary trend is up and likely to remain so unless we witness further provocation from the North. Upward breakout would indicate another primary advance. Twiggs Money Flow (13-week) holding high above zero reflects strong buying pressure.
South Korea


China

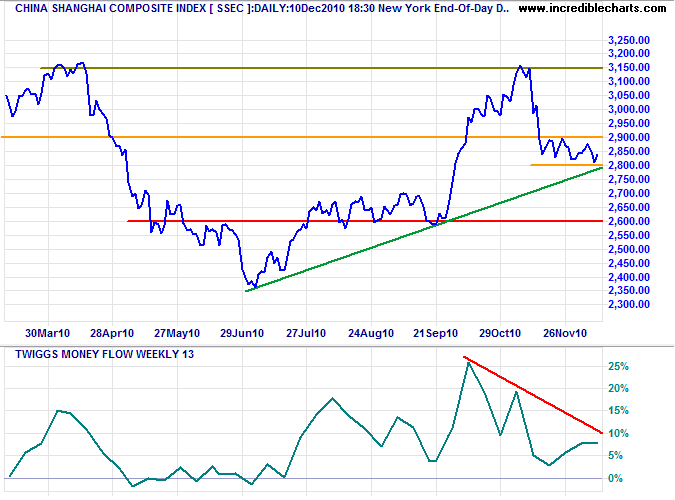
The Shanghai Composite index broke through resistance at 2900. Expect retracement to test the new support level. Respect would suggest an advance to 3150. Bearish divergence on Twiggs Money Flow (13-week), however, warns of selling pressure. Reversal below 2800 would offer a target of primary support at 2600*.
Shanghai Composite Index
* Target calculations: 2800 - ( 3100 - 2900 ) = 2600
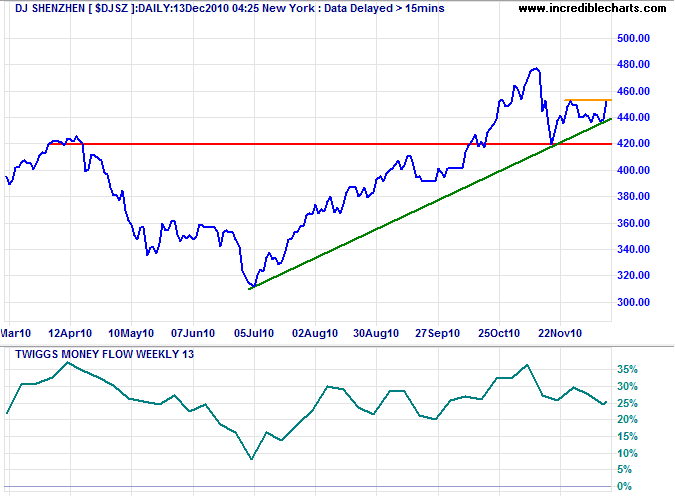
The DJ Shenzhen Index remains positive, with 13-week Twiggs Money Flow holding high above zero. Breakout above 453 would suggest an advance to 540*.
Shenzhen Index
* Target calculation: 480 + ( 480 - 420 ) = 540
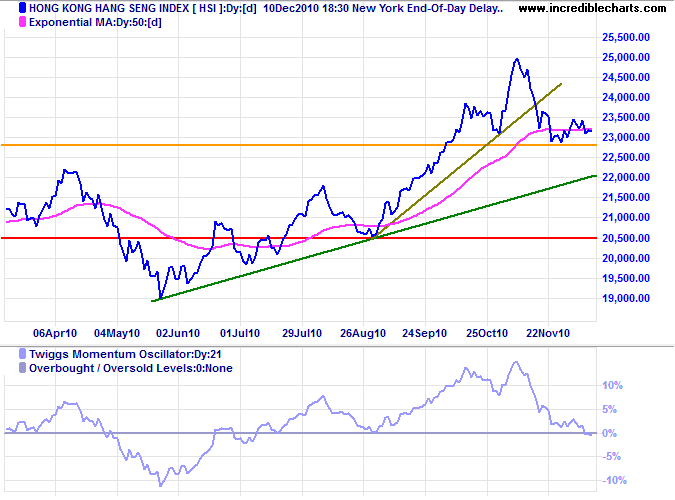
The Hang Seng Index is consolidating between 23500 and 22800. Bearish divergence on Twiggs Money Flow (13-week) continues to warn of selling pressure and Momentum falling below zero warns of a reversal. Failure of support would offer a target of 21000*, while recovery above 23500 would suggest another test of 25000.
Hang Seng Index Hongkong
* Target calculation: 23000 - ( 25000 - 23000 ) = 21000


Brazil

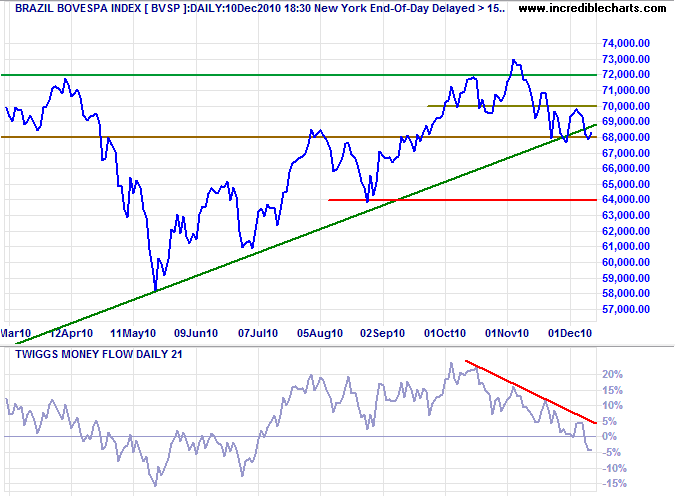
The Bovespa Index is again testing support at 68000. Twiggs Money Flow (21-day) declining below zero warns of selling pressure. Breakout below 68000 would test primary support at 64000. Recovery above 70000 is less likely, but would suggest another test of 73000.
Brazil Bovespa
* Target calculation: 70000 + ( 70000 - 60000 ) = 80000


Australia: ASX

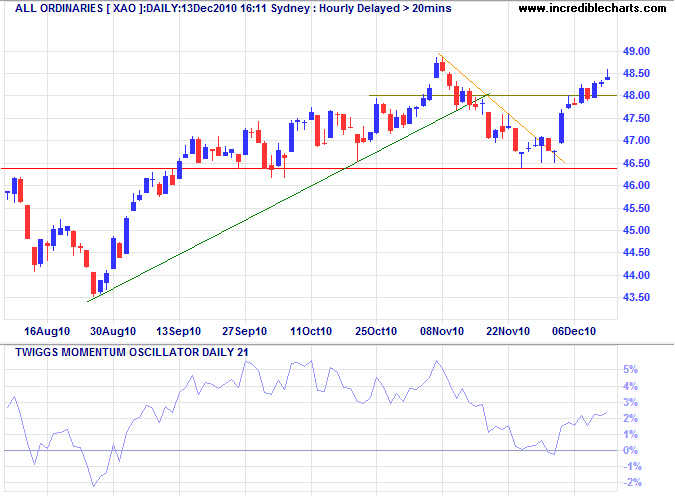
The All Ordinaries is headed for another test of resistance at 5000. Bearish divergence on Twiggs Money Flow (21-day), however, warns of medium-term selling pressure. Twiggs Momentum reversal below zero would warn of a primary trend reversal. Failure of support at 4640 would confirm.
ASX All Ordinaries
* Target calculation: 4650 + ( 4650 - 4250 ) = 5050
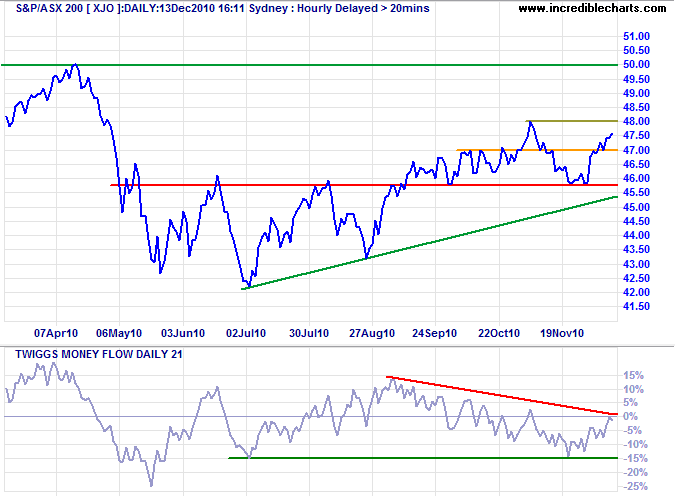
An ASX 200 breakout above 4800 would indicate an advance to 5000. Twiggs Money Flow (21-day) below zero, however, warns of medium-term selling pressure and reversal below 4575 would signal a primary trend reversal.
ASX 200


Little progress can be made by merely attempting to repress what is evil. Our great hope lies in developing what is good.

OM SHRI GANESHAYA NAMAH

Monday, December 13, 2010

NIFTY WEEKLY & DAILY OUTLOOK DEC 13, 2010


As advised last Monday to take short position on rise above the level of 6000 and further more shorts to be added below the level of5930, from 6070 market fall till the level of 5720. For this week watch out level of 5845 on downside and 5970 on upside, move above or below the level will decide the next move in market. Our views still remain negative on market, use rally for taking fresh short position in market near the level of 5900 but stop loss of 5970 on closing basis on nifty spot is a must for downside target of 5735/5625/5515, further shorts can be added if market manage to remain below the level of 5845. On upside if market manage to close above 5970, one can take long position in market for upside target 6065/6170/6280, but stop loss of 5840 on closing basis on nifty spot is a must.

For the day, the level of 5840 and 5810 may act as a major support for the market and the level of 5870 and 5895 may act as a major hurdle. Market may remain highly volatile.

"Spot Levels" Day trader can go long on nifty above 5870 with stop loss 5840 for target 5895 / 5925 and can go short below 5840 with stop loss 5850 for target 5810 / 5785.

Index Range

Nifty: 5857.35
Range: 5785-5925
Resistance: 5870-5895-5925
Support: 5840-5815-5785

Bank Nifty: 11447
Range: 11160-11700
Resistance: 11485-11593-11700
Support: 11375-11265-11160

Short term: Down (5930)
Medium term: Down (6030)
Long term: Up (5350)

Cash Market Trading Activity (Prov. Figure in Rs. Crores)

Cat: Buy Val - Sell Val=   Net Val
FII: 3528.41-4767.66= -1239.25
DII: 2124.53-1376.88= +747.65

All Above Spot Levels

OM SHRI GANESHAYA NAMAH

Astro View on Nifty 13th December 2010


•December's highly volatile, widely fluctuating dates are: 7 (-19), 8 (-72), 16, 17, 21, 22, 23, 24
•During this week, the trading is likely to be only for four days, so make a note of it.
•Today's Nifty-based scrip: IDBI Bank, Vijaya Bank
•Today's Scrips: Abhishek Corporation Limited, Asahi India Glass Limited, AVT Natural Products, Bajaj Hindustan, Carborundum Univ, Cheslind Textile, Dhampur Sugar, GI Engineering Solns ltd, ICRA, JB Chem & Pharma, NITCO Limited, Oudh Sugar Mills, Polyplex Corpn, Rane Eng Valve ltd, Sanwaria Agro Oils, Sicagen India Limited, Torrent Pharma, UTV Software Communication.
•In the same column, on last Monday, Ganesha had predicted that real estate and media sector would remain in the news. Practically, you must have noted the results.
•In the same column, on last Monday, Ganesha had also warned you and asked you to watch your step. You must have observed the result here as well.

Source: GaneshaSpeaks

OM SHRI GANESHAYA NAMAH
Friday, December 10, 2010

ANOTHER OPTION JACKPOT CALL : BUY 5700 PUTS CMP 62 AND BUY 6000 CALL CMP 48


ANOTHER OPTION JACKPOT CALL
BUY 5700 PUTS CMP 62 AND BUY 6000 CALL CMP 48
TOTAL COST 110 EXPECTED TARGET 140-160
OUR BUYING COST @102-106 (TOO VOLATILE)
OM SHRI GANESHAYA NAMAH

UPDATE ON NIFTY SHORT POSITION : REVISED STOP LOSS / TARGETS / 40% BOOK


Positional short recommended above the level of 6000 and added more below the level of 5930 hit target 1 of 5845, can book 40% of the short position at market and hold remaining position with stop loss of 5845 closing basis on nifty spot for targets 5625 and 5410.

IF MARKET MANAGE TO GIVE CLOSING BELOW 5845 TODAY THEN NEXT WEEK FOR SURE WE WOULD BE HITTING LEVEL OF 5645 ON NIFTY SPOT .

THOSE WHO ARE HOLDING POSITIONAL SHORT CAN KEEP A STOP LOSS OF 5845 CLOSING BASIS ON NIFTY SPOT .... AND EVEN FOR THOSE WHO WANT TO TAKE FRESH SHORT HERE

OM SHRI GANESHAYA NAMAH

NIFTY DAILY OUTLOOK DEC 10, 2010


On Thursday, market opened flat and started falling step by step down however market faced heavy selling pressure during final hour of trading session with selling across all indices and closed down in red. Overall it was a highly volatile trading session. Volume for the day was higher then previous trading session. Market breadth was negative. Midcap and Small caps index closed down in red.

For the day, the level of 5750 and 5725 may act as a major support for the market and the level of 5810 and 5836 may act as a major hurdle. Market may remain highly volatile.
"Spot Levels" Day trader can go long on nifty above 5810 with stop loss 5780 for target 5835 / 5870 and can go short below 5750 with stop loss 5780 for target 5725 / 5690.

Positional short recommended above the level of 6000 and added more below the level of 5930 hit target 1 of 5845, can book 40% of the short position at market and hold remaining position with stop loss of 5845 closing basis on nifty spot for targets 5625 and 5410.

Index Range

Nifty: 5766.50
Range: 5690-5870
Resistance: 5810-5835-5870
Support: 5750-5725-5690

Bank Nifty: 11116
Range: 10830-11375
Resistance: 11160-11265-11375
Support: 11045-10935-10830

Short term: Down (5930)
Medium term: Down (6030)
Long term: Up (5350)

Cash Market Trading Activity (Prov. Figure in Rs. Crores)

Cat: Buy Val - Sell Val=   Net Val
FII:  3726.39-5022.69= -1296.3
DII:  2235.40-1407.48= +827.92

All Above Spot Levels

OM SHRI GANESHAYA NAMAH

Astro View on Nifty 10th December 2010


•December's highly volatile, widely fluctuating dates are: 7,8,16,17,21,22,23,24

•Today, Moon is in the Shravan Nakshatra, whose Lord is Moon.

•Mercury is retrograde, thus, the banking sector may remain in the news.

•From 12:55 to 14:00, Nifty may make you do jobbing on the upper side.

Source: GaneshaSpeaks

OM SHRI GANESHAYA NAMAH
Thursday, December 9, 2010

UPDATE : 5800 PUTS AND 6200 CALLS WE HAVE BOOKED FULL PROFIT


5800 PUTS AND 6200 CALLS WE HAVE BOOKED FULL PROFIT
COST WAS BTW 72-80
HIT TARGET PREIMUM OF 110 AND 140 POINTS
GROSS PROFIT OF RS. 40 - 60
PLZ BOOK FULL PROFIT

OM SHRI GANESHAYA NAMAH

NIFTY DAILY OUTLOOK DEC 09, 2010


On Wednesday, market opened gap-down and faced heavy selling pressure thru the day, with selling across almost all the indices and closed down in red. Banks, Realty and Metals were the biggest loser. Overall it was a highly volatile trading session. Volume for the day was lower then previous trading session. Market breadth was negative. Midcap and Small caps index closed down in red.

For the day, the level of 5885 and 5860 may act as a major support for the market and the level of 5940 and 5970 may act as a major hurdle. Market may remain highly volatile; Auto and IT may attract selling pressure.

The Short term trend will turn positive above the level of 5930.

"Spot Levels" Day trader can go long on nifty above 5940 with stop loss 5910 for target 5970 / 5995 and can go short below 5885 with stop loss 5915 for target 5860 / 5830.

Index Range

Nifty: 5903.70
Range: 5830-5995
Resistance: 5940-5970-5995
Support: 5885-5860-5830

Bank Nifty: 11460.20
Range: 11280-11625
Resistance: 11520-11570-11625
Support: 11405-11350-11280

Short term: Down (5930)
Medium term: Down (6030)
Long term: Up (5350)

Cash Market Trading Activity (Prov. Figure in Rs. Crores)

Cat: Buy Val - Sell Val=   Net Val
FII:  2383.76-3868.66= -1484.9
DII:  1662.22-1253.17= -409.05

All Above Spot Levels

OM SHRI GANESHAYA NAMAH

Astro View on Nifty 9th December 2010


•December's highly volatile, widely fluctuating dates are: 7,8,16,17,21,22,23,24

•Today, Moon is in the Uttarshadha Nakshatra in the zodiac sign ??? Capricorn, whose Lord is the Sun.
•Mars-Rahu are highly volatile in the same Navamansh; it's an unpredictable day. 

•From 11:15 to 14:15, Nifty may make you do jobbing in downward trend, and then suddenly go up. 

Source: GaneshaSpeaks


OM SHRI GANESHAYA NAMAH
Tuesday, December 7, 2010

NIFTY DAILY OUTLOOK DEC 08, 2010


On Tuesday, market opened flat, traded weak in a range thru out the day and closed down in red. Banks and Realty attracted heavy selling whereas Oil & Gas and Metals attracted good buying. Overall it was a highly volatile trading session. Volume for the day was slightly higher then previous trading session. Market breadth was negative. Midcap and Small caps index closed down in red.

For the day, the level of 5965 and 5940 may act as a major support for the market and the level of 6020 and 6045 may act as a major hurdle. Banking, Realty and Metals may attract selling pressure.

The Medium term trend will turn positive above the level of 6030.

 "Spot Levels" Day trader can go long on nifty above 6020 with stop loss 5990 for target 6045 / 6070 and can go short below 5965 with stop loss 5995 for target 5940 / 5910.

Index Range

Nifty: 5976.55
Range: 5910-6075
Resistance: 6020-6045-6075
Support: 5965-5940-5910

Bank Nifty: 11695.30
Range: 11340-12000
Resistance: 11780-11890-12000
Support: 11560-12450-11340

Short term: Up (5930)
Medium term: Down (6030)
Long term: Up (5350)

Cash Market Trading Activity (Prov. Figure in Rs. Crores)

Cat: Buy Val - Sell Val=   Net Val
FII:  2914.37-3437.20= -522.83
DII:  1240.84-1668.06= -689.66

All Above Spot Levels

OM SHRI GANESHAYA NAMAH
Sunday, December 5, 2010

NIFTY WEEKLY & DAILY OUTLOOK DEC 06, 2010


As advised last Monday look for selling only below the level of 5830 and buying above 5930, from there market rallied till the level of 6025, but on Thursday we advised to cut / book long position above the level of 6000 and also advised to take short position in nifty with stop loss of 6090 on closing basis for target 5845 / 5625 / 5410. For this week watch out level of 5930 on downside and 6090 on upside, move above or below the level will decide the next move in market. Further short position can be added in nifty below the level of 5930. Our views remain negative on market but stop loss of 6090 on closing basis on nifty spot is a must.

For the day, the level of 5970 and 5940 may act as a major support for the market and the level of 6025 and 6050 may act as a major hurdle. Banking, Realty and Metals may attract selling pressure.

 "Spot Levels" Day trader can go long on nifty above 6025 with stop loss 5995 for target 6050 / 6080 and can go short below 5970 with stop loss 6000 for target 5940 / 5910.

Index Range

Nifty: 5992.80
Range: 5910-6080
Resistance: 6025-6050-6080
Support: 5970-5940-5910

Bank Nifty: 12349.20
Range: 12180-12520
Resistance: 12410-12460-12520
Support: 12290-12240-12180

Short term: Up (5830)
Medium term: Up (5930)
Long term: Up (5350)

Cash Market Trading Activity (Prov. Figure in Rs. Crores)

Cat: Buy Val - Sell Val=   Net Val
FII:  3204.98-2601.51= +603.47
DII:   832.02-1521.68=  -689.66

All Above Spot Levels

OM SHRI GANESHAYA NAMAH
Friday, December 3, 2010

NIFTY DAILY OUTLOOK DEC 03, 2010


On Thursday, market opened gap-up and traded higher in a range thru out the day with good buying in most of the indices. Metals, Realty and Banks outperformed whereas Auto and Capital Goods underperformed. Volume for the day was slightly higher then previous trading session. Market breadth was positive. Midcap and small caps index closed up in green.

For the day, the level of 5995 and 5970 may act as a major support for the market and the level of 6025 and 6050 may act as a major hurdle. Auto and IT may attract selling pressure.

Positional traders are advised to book long position above the level of 6000 and accumulate short position in nifty with stop loss of 6090 on closing basis on nifty spot for target 5845 / 5625 / 5410.  

"Spot Levels" Day trader can go long on nifty above 6025 with stop loss 5995 for target 6050 / 6080 and can go short below 5995 with stop loss 6025 for target 5970 / 5940.

The Medium term trend will turn negative below the level of 5930.

Index Range

Nifty: 6011.70
Range: 5970-6050
Resistance: 6025-6050-6080
Support: 5995-5970-5940

Bank Nifty: 12472.60
Range: 12200-12750
Resistance: 12535-12640-12750
Support: 12420-12310-12200

Short term: Up (5830)
Medium term: Up (5930)
Long term: Up (5350)

Cash Market Trading Activity (Prov. Figure in Rs. Crores)

Cat: Buy Val - Sell Val=   Net Val
FII:  4114.46-3728.34= +386.12
DII:  1317.29-1542.33= -225.04

All Above Spot Levels

OM SHRI GANESHAYA NAMAH